Quilting statistics point to a large, resilient hobby market: millions of active quilters, billions in annualized industry revenue, and a buyer base that still leans heavily toward local quilt shops for supplies.
Quilting statistics (top highlights)
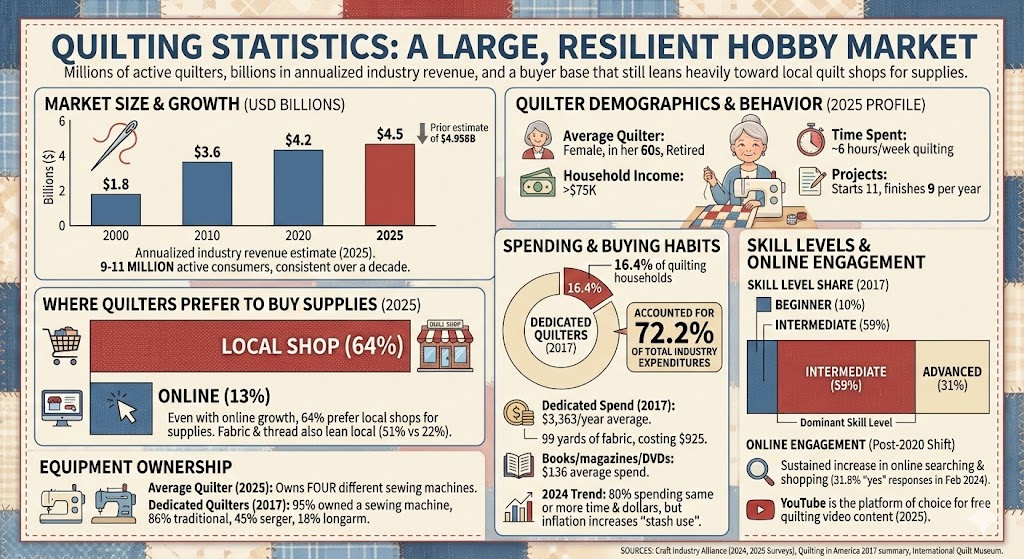
- The 2025 Quilter’s Survey summary estimates annualized quilting industry revenue at $4.5 billion (down from a prior-year estimate of $4.958B).
- The industry is described as having 9–11 million active consumers (a level said to be consistent over the past decade).
- Survey scale (2025): 1.8M+ invited and 30,000+ responses recorded.
- Average quilter profile (2025): female, in her 60s, retired, household income >$75K, spends 6 hours/week quilting, starts 11 projects/year and finishes 9.
- Where quilters prefer to buy supplies (2025): 64% prefer local shops vs 13% who prefer online.
- In the Quilting in America 2017 summary: 7–10 million quilters in the U.S., 6–8.3 million quilting households, and $3.7B total spent in the quilting industry.
- Dedicated quilters (2017) were 16.4% of quilting households but accounted for 72.2% of total industry expenditures.
How big is the quilting market?
Recent consumer-survey summaries place quilting as a multi-billion-dollar category. In 2025, the quilting industry’s annualized revenue estimate was $4.5B, and the same source cites earlier benchmarks of $1.8B (2000), $3.6B (2010), and $4.2B (2020).
Bar chart: Annualized quilting industry revenue (selected years, USD billions)
| Label | Bar | Value |
|---|---|---|
| 2000 | 1.8 | |
| 2010 | 3.6 | |
| 2020 | 4.2 | |
| 2025 | 4.5 |
Max = 4.5. Widths: 2000 40.00%, 2010 80.00%, 2020 93.33%, 2025 100.00%.
Older market snapshots also point to multi-billion-dollar annual spending: Quilting in America reported $3.7B spent in the U.S. quilting industry in 2017.
How many people quilt?
Most widely cited consumer research puts the number of U.S. quilters in the single-digit-to-low-double-digit millions. The 2025 survey summary describes the industry as having 9–11 million active consumers.
For context, Quilting in America (2017) reported 7–10 million U.S. quilters and 6–8.3 million quilting households.
Another commonly cited reference notes that around 10 million Americans quilt, attributing the claim to the 2022 Quilting Trends Survey.
Quilter demographics and behavior
Across recent survey summaries, the “average quilter” profile is remarkably consistent: female and in her 60s, often retired, with mid-to-upper household income, and comfortable using technology.
- Gender and retirement (2024): 98% identify as female and 70% are retired.
- Household income (2024–2025): $70K+ in 2024; >$75K in 2025.
- Time spent: average of 6 hours per week on quilting projects (2024–2025).
- Project volume: starts 11 projects/year and finishes 9 (2024–2025).
- Heavier participants (2024): 65% spend more than 6 hours/week quilting.
Where quilters buy supplies
Quilting remains unusually “local retail friendly” compared with many other hobby categories. In 2025, 64% of quilters preferred buying supplies at a local shop versus 13% preferring online; fabric and thread leaned local too (51% local vs 22% online).
The 2024 survey summary shows a similar split for supplies overall (61% local quilt shop vs 16% online).
Bar chart: Preferred place to buy quilting supplies (2025)
Values below are the share of respondents who said they prefer each channel for quilting supplies.
| Label | Bar | Value |
|---|---|---|
| Local shop | 64% | |
| Online | 13% |
Max = 64. Widths: Local shop 100.00%, Online 20.31%.
Online engagement and the “post-2020” shift
Even with strong local-store preference, research summaries point to a sustained increase in online searching and shopping compared with pre-2020 baselines. One survey question showed “yes” responses rising from 24.4% (Feb 2020) to 42.2% (Feb 2021), then settling at 31.8% (Feb 2024)..
In 2025, the same survey summary explicitly calls out YouTube as the platform of choice for free quilting video content.
Spending and buying habits
Quilting spend tends to be concentrated among highly committed hobbyists. In 2017, “dedicated quilters” (defined as households spending more than $500/year on quilting-related purchases) represented 16.4% of quilting households but accounted for 72.2% of total industry expenditures.
- Dedicated quilter average spend (2017): $3,363 per year on quilting.
- Fabric volume (2017, dedicated quilter): 99 yards of fabric in the past 12 months, costing $925 (about $9.34/yard).
- Books/magazines/DVDs (2017, dedicated quilter): $136 average spend in the past 12 months.
In 2024, the majority of quilters (80%) said they were spending the same or more time and dollars than in previous years, while inflation pressures also increased “stash use” versus buying new fabric.
Equipment ownership
Machine ownership is widespread among committed quilters. In 2025, the average quilter was described as owning four different sewing machines.
In 2017’s dedicated-quilter profile: 95% owned a sewing machine, including 86% with a traditional machine, 45% with a serger, and 18% owning a longarm.
Skill levels (and why “intermediate” dominates)
Skill self-identification tends to cluster in the middle. In 2017, quilters were distributed as 10% beginner, 59% intermediate, and 31% advanced.
Bar chart: Quilter skill level share (2017)
| Label | Bar | Value |
|---|---|---|
| Beginner | 10% | |
| Intermediate | 59% | |
| Advanced | 31% |
Max = 59. Widths: Beginner 16.95%, Intermediate 100.00%, Advanced 52.54%.
Sources
- Craft Industry Alliance — “The Size of the Quilting Market: Quilting Trends Survey Results 2025” (May 2025).
- Craft Industry Alliance — “The Size of the Quilting Market: Quilting Trends Survey Results 2024” (May 2024).
- Quilting in America 2017 summary (FabShop News PDF).
- World Quilts: The American Story (International Quilt Museum / University of Nebraska-Lincoln) — “Identity” page citing U.S. quilting participation.