Etsy is still one of the world’s biggest marketplaces for handmade, vintage, and customized goods—powered by millions of small sellers and tens of millions of active buyers. The stats below summarize Etsy’s marketplace size, sales volume (GMS), revenue, take rate, mobile mix, and key shifts seen in the latest reported quarters.
Etsy Statistics (Top Highlights)
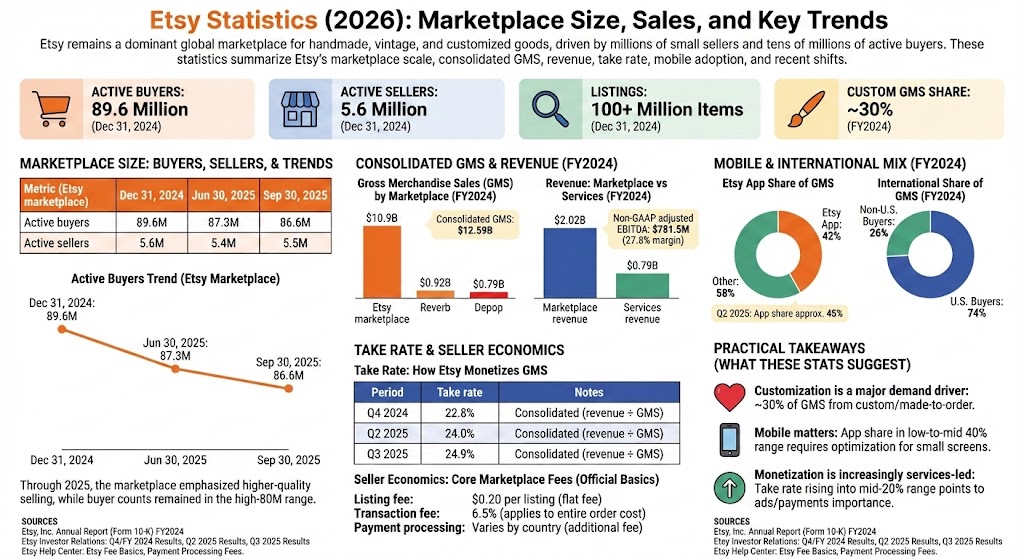
- Etsy marketplace active buyers: 89.6 million (as of December 31, 2024).
- Etsy marketplace active sellers: 5.6 million (as of December 31, 2024).
- Etsy marketplace listings: 100+ million items (as of December 31, 2024).
- Share of Etsy marketplace GMS from custom or made-to-order items: ~30% (FY2024).
- Top six Etsy retail categories represented about $9 billion (87%) of 2024 Etsy marketplace GMS.
- Consolidated GMS (all marketplaces): $12.59B in 2024.
- Consolidated revenue: $2.81B in 2024 (up 2.2% YoY).
- Non-GAAP adjusted EBITDA: $781.5M in 2024 (27.8% margin).
- Etsy App share: about 42% of 2024 Etsy marketplace GMS (and about 45% in Q2 2025).
- Geography: in 2024, 74% of GMS came from U.S. buyers and 26% from non-U.S. buyers.
- Latest reported quarter (Etsy marketplace): active buyers 86.6M and active sellers 5.5M (quarter ended September 30, 2025).
Marketplace Size: Buyers, Sellers, and Listings
At the end of 2024, Etsy’s core marketplace reported 89.6M active buyers and 5.6M active sellers, with 100+ million items listed. Through 2025, the marketplace continued to emphasize higher-quality selling activity (including the impact of a seller set-up fee), while active-buyer counts remained in the high-80-million range.
| Metric (Etsy marketplace) | Dec 31, 2024 | Jun 30, 2025 | Sep 30, 2025 |
|---|---|---|---|
| Active buyers | 89.6M | 87.3M | 86.6M |
| Active sellers | 5.6M | 5.4M | 5.5M |
Active Buyers Trend (Etsy Marketplace)
| Label | Bar | Value |
|---|---|---|
| Dec 31, 2024 | 89.6M | |
| Jun 30, 2025 | 87.3M | |
| Sep 30, 2025 | 86.6M |
Max = 89.6M. Widths: Dec 31, 2024 100.00%, Jun 30, 2025 97.43%, Sep 30, 2025 96.65%.
Revenue: Marketplace vs Services (FY2024)
Etsy reports revenue in two major buckets: Marketplace revenue (transaction fees and related marketplace activity) and Services revenue (including offerings such as advertising and payments-related services). In FY2024, Marketplace remained the larger revenue stream, while Services continued to be a meaningful contributor.
| Label | Bar | Value |
|---|---|---|
| Marketplace revenue | $2.02B | |
| Services revenue | $0.79B |
Max = $2.02B. Widths: Marketplace revenue 100.00%, Services revenue 38.98%.
Gross Merchandise Sales (GMS) by Marketplace (FY2024)
Etsy reports consolidated GMS across its marketplaces (including Depop and, in 2024, Reverb). In FY2024, the core Etsy marketplace drove the bulk of consolidated GMS.
| Label | Bar | Value |
|---|---|---|
| Etsy marketplace | $10.9B | |
| Reverb | $0.92B | |
| Depop | $0.79B |
Max = $10.9B. Widths: Etsy marketplace 100.00%, Reverb 8.42%, Depop 7.24%.
Take Rate: How Etsy Monetizes GMS
Etsy commonly references “take rate” as consolidated revenue divided by consolidated GMS. Recent quarters showed take rate in the low-to-mid 20% range, with on-site ads and payments-related services frequently cited as contributors.
| Period | Take rate | Notes |
|---|---|---|
| Q4 2024 | 22.8% | Consolidated (revenue ÷ GMS) |
| Q2 2025 | 24.0% | Consolidated (revenue ÷ GMS) |
| Q3 2025 | 24.9% | Consolidated (revenue ÷ GMS) |
Seller Economics: Core Marketplace Fees (Official Basics)
- Listing fee: $0.20 per listing (flat fee).
- Transaction fee: 6.5% (applies to the cost of the entire order).
- Payment processing: varies by country and is charged in addition to the transaction fee.
Mobile & App Mix
Etsy has continued to push app-led shopping and discovery. In 2024, approximately 42% of Etsy marketplace GMS came from purchases completed on the Etsy app; in Q2 2025, the Etsy app represented approximately 45% of Etsy marketplace GMS.
International Share of GMS
In 2024, Etsy reported that 74% of its GMS came from U.S. buyers and 26% came from buyers outside the U.S., reflecting a large (but still minority) international contribution to total sales volume.
What These Etsy Stats Suggest (Practical Takeaways)
- Customization is a major demand driver: with roughly 30% of GMS coming from custom or made-to-order items, personalization remains a core competitive edge.
- Mobile matters: app share in the low-to-mid 40% range means listings, photos, and titles need to be optimized for small-screen browsing.
- Monetization is increasingly services-led: take rate rising into the mid-20% range points to ads/payments becoming more central to Etsy’s revenue mix.
Sources
- Etsy, Inc. Annual Report (Form 10-K) for fiscal year ended December 31, 2024 (marketplace active buyers/sellers, listings, custom share, category mix, geography mix, app share).
- Etsy Investor Relations: Fourth Quarter and Full Year 2024 Results (GMS, revenue, segment revenue, net income, adjusted EBITDA, take rate, app share).
- Etsy Investor Relations: Second Quarter 2025 Results (active buyers, app share, take rate, revenue, GMS).
- Etsy Investor Relations: Third Quarter 2025 Results (active buyers/sellers, take rate, revenue, GMS).
- Etsy Help Center: Etsy Fee Basics; Payment Processing Fees (listing fee, transaction fee, payments fee context).